Discover
Full transparency of your production processes
The EthonAI Observer software combines all your production data in one place and makes it easy to monitor process behavior in real-time. Our builtin data search engine is an intuitive chat-based tool to quickly create exactly those insights that fit your specific needs.
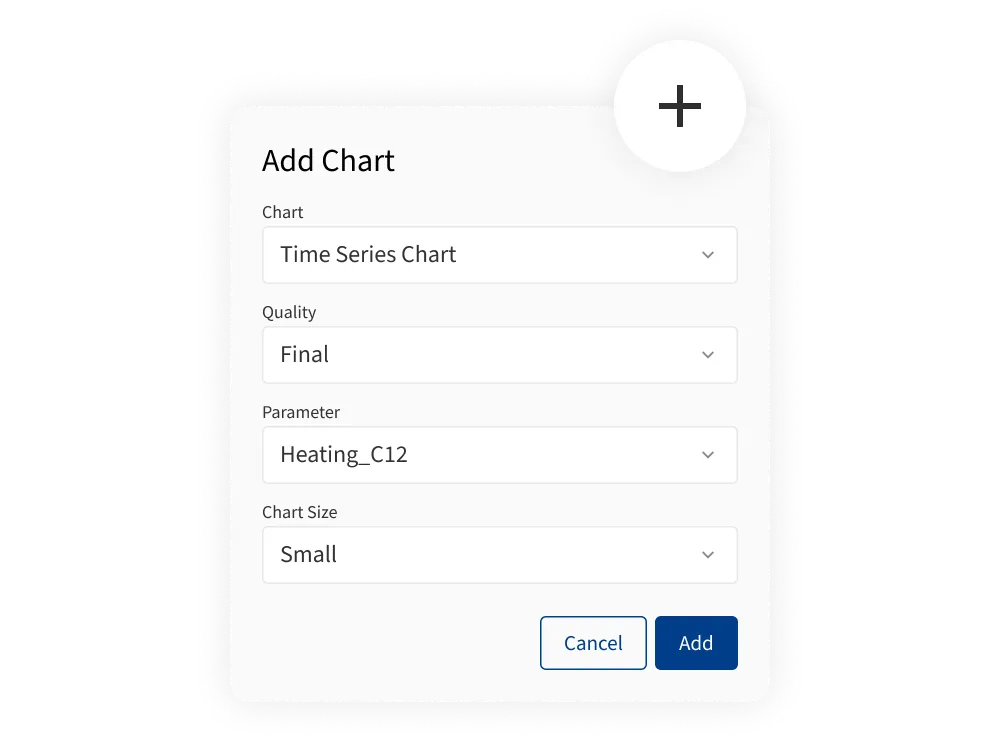
No Code
Use ready-made charts and our data search engine to quickly create process monitors that exactly fit your needs.
Multivariate Analysis
Bring statistical process control into the digital age. Simplify the monitoring of hundreds of parameters into meaningful summary charts.
Data Transparency
Work with contextual layers such as line stops, machine status codes, product variants, or defect types.
Capabilities
Process monitoring has never been easier
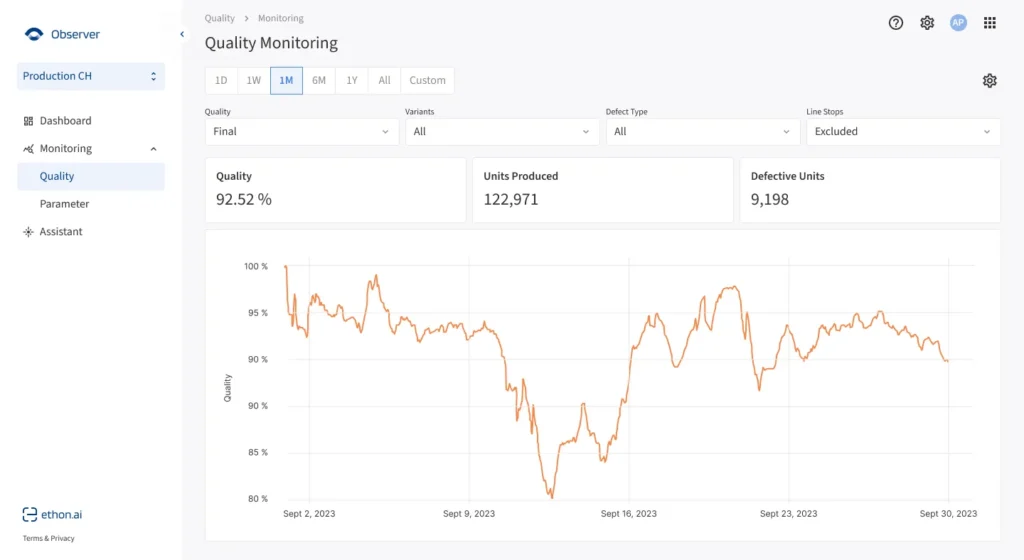
Real-time process observability
The number of factors influencing your production can be overwhelming. The Observer lets you dig into your data with interactive visualizations. Curate a dashboard of charts that you need to constantly see. They will update in real-time and keep you on top of things. Build separate dashboards for line managers to track KPIs. Make their operational decisions quick and effective.
At a glance
- Clearly show the states and trends in your production data.
- Easily explore past and current parameters and quality metrics.
- Communicate your findings effectively across stakeholders.
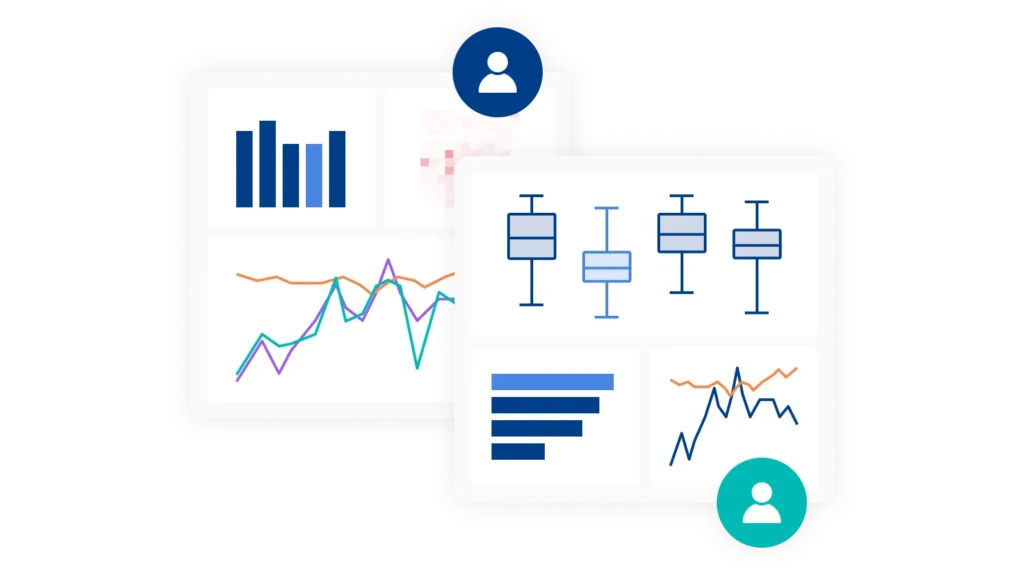
Data clarity
The Observer software brings transparency to your production line data. It is easy to use, can be extended with custom visualizations beyond time series charts, and works hand-in-hand with the EthonAI Analyst to bring in cutting-edge AI when needed.
At a glance
- Go beyond classical SPC thanks to richer visualizations and customizations.
- Use deeper data insights to make better operational decisions, faster.
- Use interactive charts to dive deeper into your production line data.
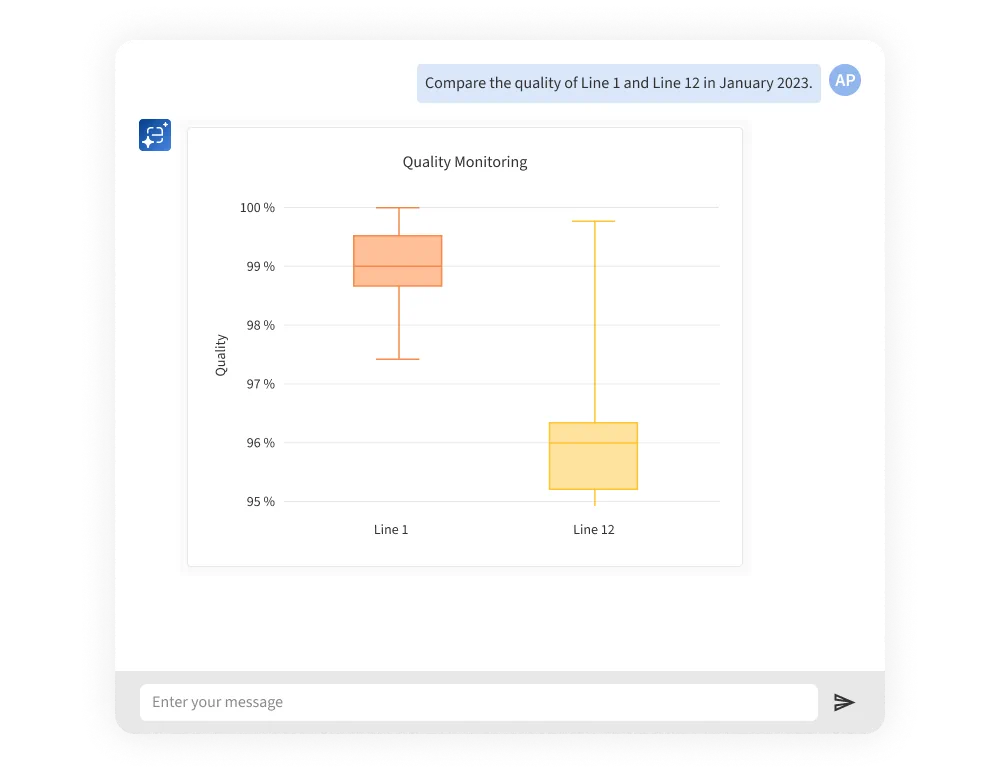
Chat-based data search
The Observer comes with a data search engine to pinpoint the most relevant information for your evolving needs. Instead of manually exploring hundreds of parameters and ways of plotting them, you can chat with a natural language interface. It makes it easy to create custom charts that are tailored for your needs.
At a glance
- Intuitive way of searching through your production data.
- Chat with the Observer software to quickly get summarized insights.
- Easily create custom plots, instead of tediously sifting through reams of data.
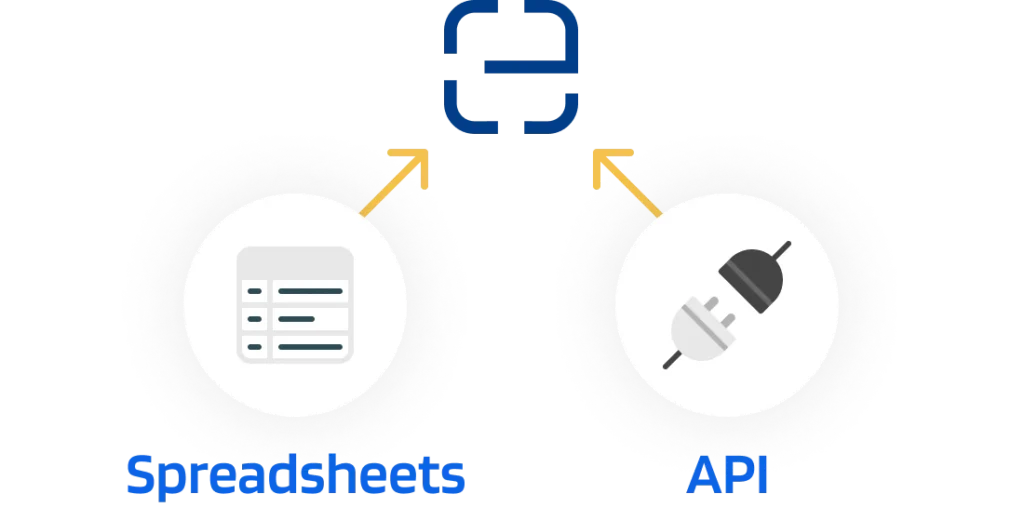
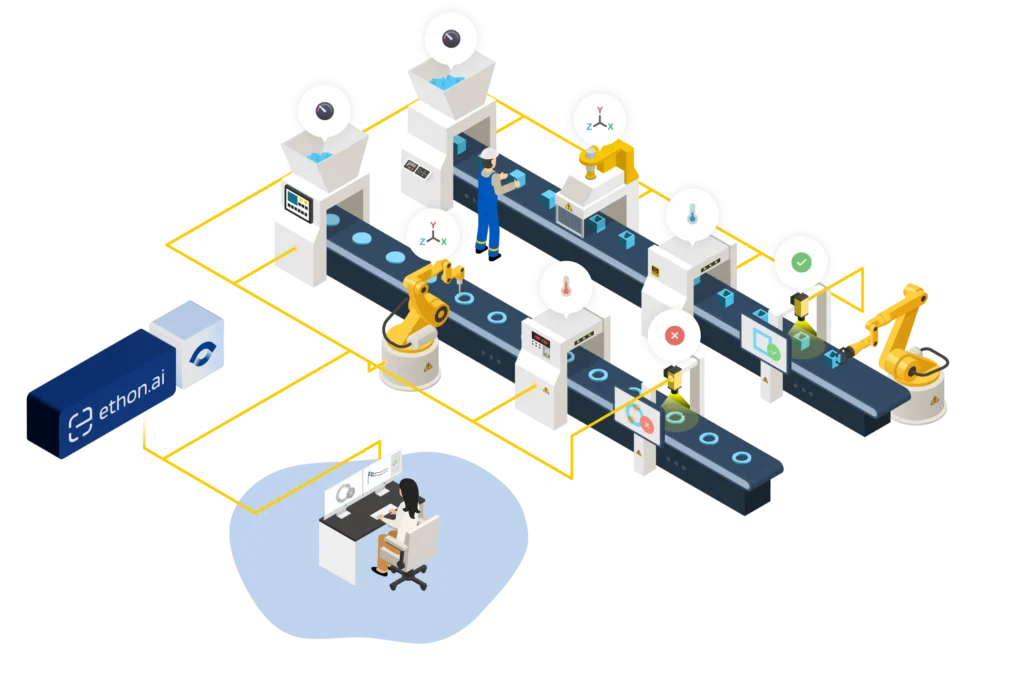
Flexible data integration
The Observer ingests and contextualizes data from multiple production lines, no matter the format of your process and quality measurements. It supports time series, event data, and other annotation formats. You can quickly get started using individually uploaded spreadsheets, and later build out real-time integrations via our factory-to-cloud API.
At a glance
- We quickly integrate any data format you may be using.
- No need to first build a complex data pipeline. Gain insights right away.
- Receive hands-on advice for your journey to full data transparency across all your factories.
Use Cases
Leading manufacturers trust our software
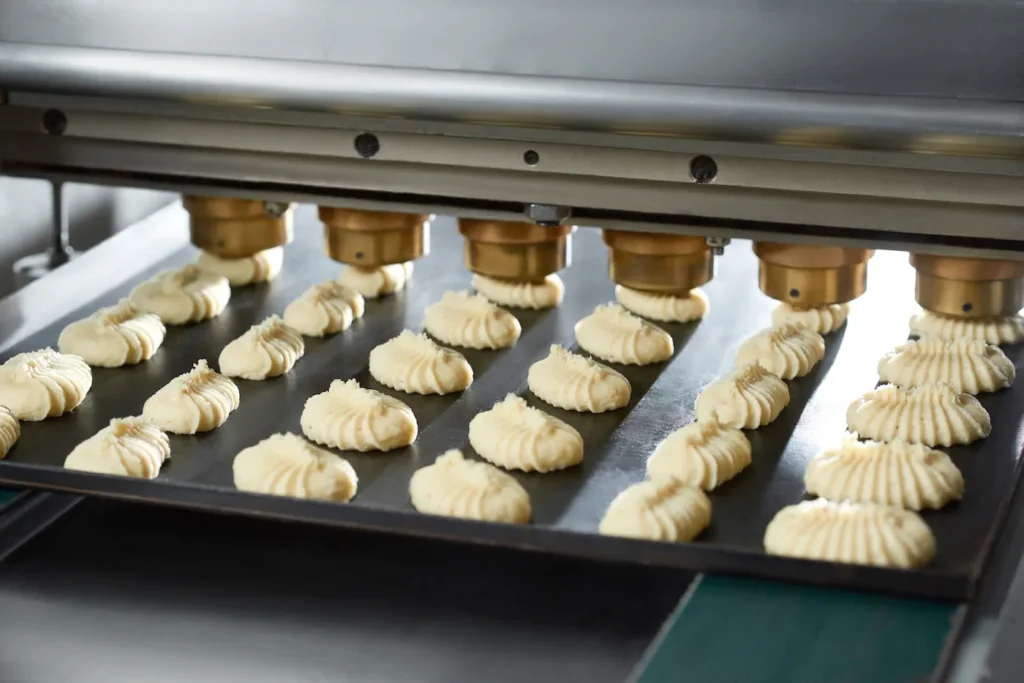
Food Production
- Increase process transparency in food production.
- Cross-factory comparisons of quality and process parameters.
- Streamline decision-making on the factory floor.

Pulp and Paper
- Detect excursions across operational sections in paper machines.
- Easily create SKU-specific targets and charts for SKU-specific SOPs.
- Close digitalization gaps and start with a full-featured solution that gets you ready for analytics.
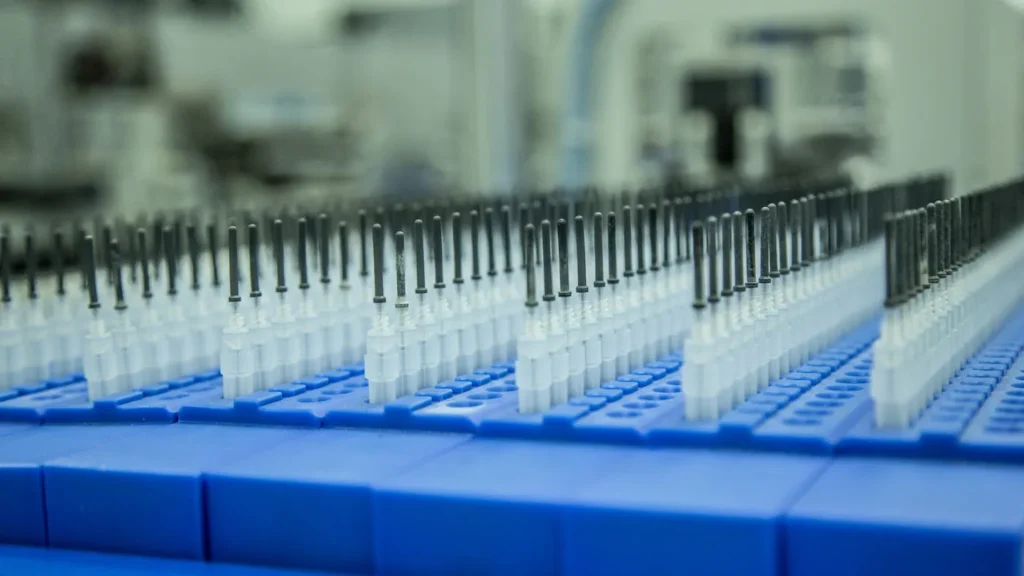
Plastics
- Early warnings for anomalous process behavior in plastics production.
- Multivariate monitoring of machine parameters.
- Collect alerts in a unified dashboard.